Piecewise Quadratics
EXAMPLE 1:
Let's first look at an example of a function with "three pieces."
f(x) =
x2 - 2, x < 1
4, x = 1
3 - x, x >1
① The first piece, f(x) = x2 - 2 when x < 1 is a parabola. Since the coefficient of x2 is positive, you know that it is a upward opening parabola. If that leading coefficient had been negative, then the graph would be an "upside down" parabola, or a parabola opening downwards.The most important point to include on a parabola is its vertex.
For a regular, normal y = x2 parabola, the vertex is located at (0,0). However, for this parabola, we have subtracted a 2 after the x2. There are two ways we can use this information to find the vertex. This is a shift downward of the parabola which tells you that the vertex is (0, -2).
Another method is to think of the equation as being in the general form of a standard quadratic, y = ax2 + bx + c where b = 0. In this form, the vertex is found by calculating the point (-b/2a, y) which would yield (0/2,y ). Substituting 0 for x you get y = -2. That gives you the point (0, -2) which is identical to our other method of finding the vertex.
② The second piece f(x) = 4 when x = 1, gives you one point on the graph, (1, 4), which would be a "solid circle" when graphed.
③ The final piece is f(x) = 3 - x when x > 1. This piece is linear since there are no powers of x.
Let's now look at a table of values for f(x) to learn how "big of a graph" you will need to use.
When choosing values for x in the first parabolic piece, you want to look at keeping the symmetry around the vertex of the parabola, hence the choices of x = -1, 0, and 1.
Notice x = 1 is in all three pieces. This is because each domain statement contains the function's behavior around 1.
x f(x) -1 -1 0 -2 1 -1 (open) 1 4 (closed) 1 2 (open) 2 1 3 2
To set up your graph, you want to examine the smallest and largest value required for both x and y.
When graphing on the AP exam, if there is no scale on an axis the assumption is that the scale is 1. An arrow at the end of a graphed segment tells the reader that the graph "continues on with the same behavior."
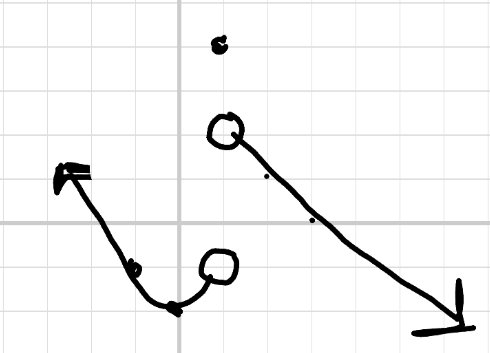
Before moving on to the next problem, you need to make sure that the graph is "reasonable."
- Does the graph contain arrows?
- Are the arrows going in opposite directions (to larger and smaller values of x)?
- The parabola has an arrow pointing up and to the left; while the linear part has an arrow points down and to the right.
- If the arrows point in the same direction there will be overlap and you will no longer have a function.
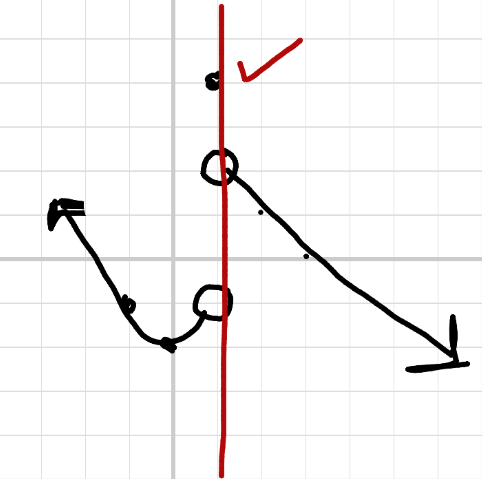
- Apply the vertical line test to the graph. On this graph the only area of concern is when x = 1. Note that there are two open circles and only one solid circle. Therefore x is only mapped to one value and you do have a function.
EXAMPLE 2:
g(x) =
1 - x2, x < 0
x - 1, x ≥0
As you look at the pieces, you see
- an x2 in the ① first piece which tells you that it is parabolic.
- Since the coefficient of x2 is negative, you know that the parabola is a downward opening parabola.
- As before, determining the vertex of the parabola is a necessary point. In this case, the 1 - x2 shifts the parabola up one, so the vertex is at (0, 1). If you want to again discover the vertex from the standard quadratic form, (-b/2a, y), you would find that b = 0 as there is no single power x term in our equation. The vertex x-coordinate that you would get is: (0/-2, y) = (0, y). Substituting in 0 for x you would once again get y = +1. The same answer as before, (0, 1).
- ①The second piece of the function is linear. It has no powers so there are no special points.
Again you need to set up a table of values for g(x).There will be "two parts" to the table since there are two pieces to the function.
Since the vertex is at (0, 1) and 0 is an endpoint in our table, we know that we will be graphing "half" of the parabola.
x g(x) -2 -3 -1 0 0 1 (open) 0 -1 (closed) 1 0 2 1
To set up your graph, you want to examine the smallest and largest value required for both x and y. As in the previous example, we can scale our axes by ones.
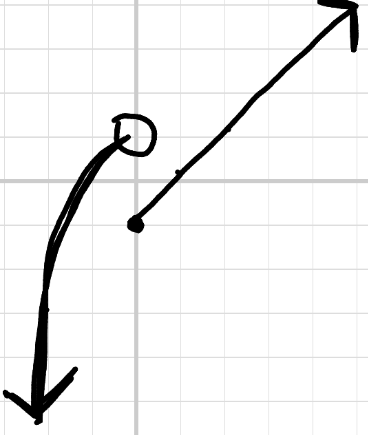
- Does the graph contain arrows?
- Are the arrows going in opposite directions (to larger and smaller values of x)?
- The parabola has an arrow pointing down and to the left; while the line has an arrow pointing up and to the right.
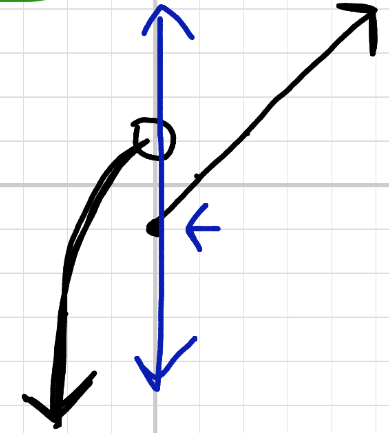
- Apply the vertical line test to the graph. On this graph the only area of concern is when x = 0. Note that there is only one open circle and one solid circle. Therefore x is only mapped to one value and you do have a function.
EXAMPLE 3:
In this example, you are given the graph of a piecewise function for which you are asked to write the equations for its pieces.
On a graph remember that arrows running "off of the paper" signify that the behavior continues to +∞ and -∞ and MUST have arrows.
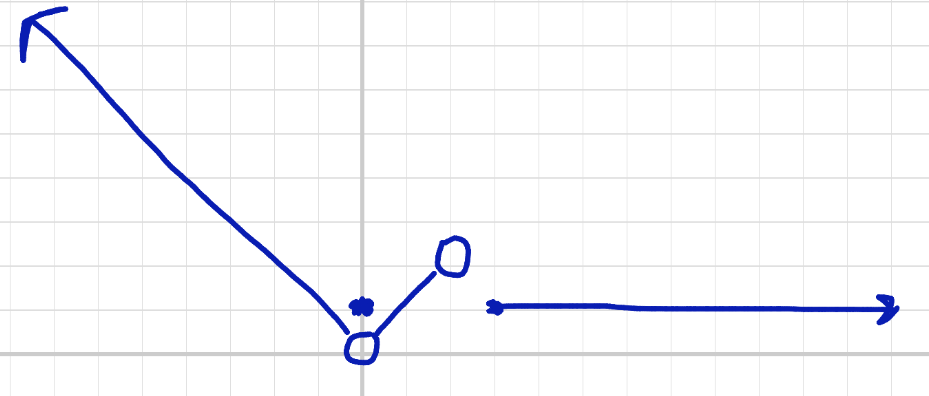
To begin the solution you need to consider how many pieces make up the function, in this case there are 4. To complete our task, each piece must have its domain stated correctly, as well as f(x) for that piece.
① For the 1st piece there is an arrow to the left and an open circle at (0, 0) which tells you that the domain is x < 0. This piece has the shape of a line, so you would use y = mx + b to calculate its equation.
- looking at positions on the line, you can see that it goes down one, over one, so the slope is -1.
- the line runs right into the y-axis at 0, so the y-intercept would be 0.
- y = mx + b → y = (-1)x + 0 → y = -1
② The second function piece is the single dot whose coordinates are (0, 1).
③For third linear piece we can again use y = mx + b.
- looking at positions on the line, you can see that the line goes up one, over one, so the slope is +1.
- the line runs right into the y-axis at 0, so the y-intercept would be 0.
- y = mx + b → y = (1)x + 0 → y = 1
- this section has two endpoints, both of which are open circles, which means you would use < signs.
④This last piece is linear with a slope equal to 0. Even though it does not actually touch the y-axis, you can "extend it back" and see the y-intercept = 1. This gives us the equation for this piece as y = 1. It has a closed circle at x = 3.
Your answer to this problem is summarized below.
g(x) =
- x2, x < 0 (open)
1, x = 0 (closed)
x, 0 < x < 2 (open)
1, x ≥3
Examining other details
- If you apply the vertical line test to the graph, the only area of concern is when x = 0. Note that there are two open circles and one solid circle. Therefore x is only mapped to one value of y and you do have a function.
- Question: is this function continuous? That is, is there a value f(x) for every x in the graphed interval from -∞ to +∞? Why infinity? Because of the left and right arrows extending off the graph.
- That answer is no, since x values in the interval, 2 ≤ x < 3 have no defined y-values.